TLDR
Our objective was to process images from technical documentation, such as state and flowchart diagrams, converting them into textual information for further use in Retrieval Augmented Generation (RAG) or for reconstruction into text-friendly Mermaid UML diagrams. Through a series of tests with OpenAI Vision, we aimed to explore its effectiveness in identifying and translating these images into structured text. Despite achieving high accuracy in text recognition within the images, we encountered substantial challenges in accurately capturing the diagrams’ complexities and translating them into coherent textual or Mermaid UML formats. These experiments highlighted the potential and current limitations of AI in this domain, pointing towards the necessity for further refined approaches or alternative processing strategies.
Context and Objective
In the ever-evolving landscape of technology, the quest to efficiently convert complex technical documentation into accessible, structured formats remains a significant challenge. This series embarks on a detailed exploration of leveraging OpenAI Vision to transform Draw.IO-based diagrams within corporate documentation into textual representations, specifically targeting the generation of Mermaid UML diagrams (usable for textual processing and diagram-based presentation of the same data).
Our primary goal is to harness the capabilities of OpenAI Vision for processing technical images embedded in documents (in our case the original format are pictures on Atlassian Confuence pages). These images, ranging from state diagrams to flowcharts, encapsulate vital information that, if accurately converted into a documentable format such as Markdown, could significantly enhance automated text processing and analysis workflows.
The Methodology
The approach involves feeding these diagrams to OpenAI Vision and prompting it to generate textual descriptions in the form of Mermaid UML format (we already used previously this format for generating diagrams based on unstructured textual information). This process was divided into several tests, each designed to evaluate the AI’s proficiency in different aspects: its ability to recognize various graph models, translate them into textual structures, and maintain the integrity of the original diagram’s information.
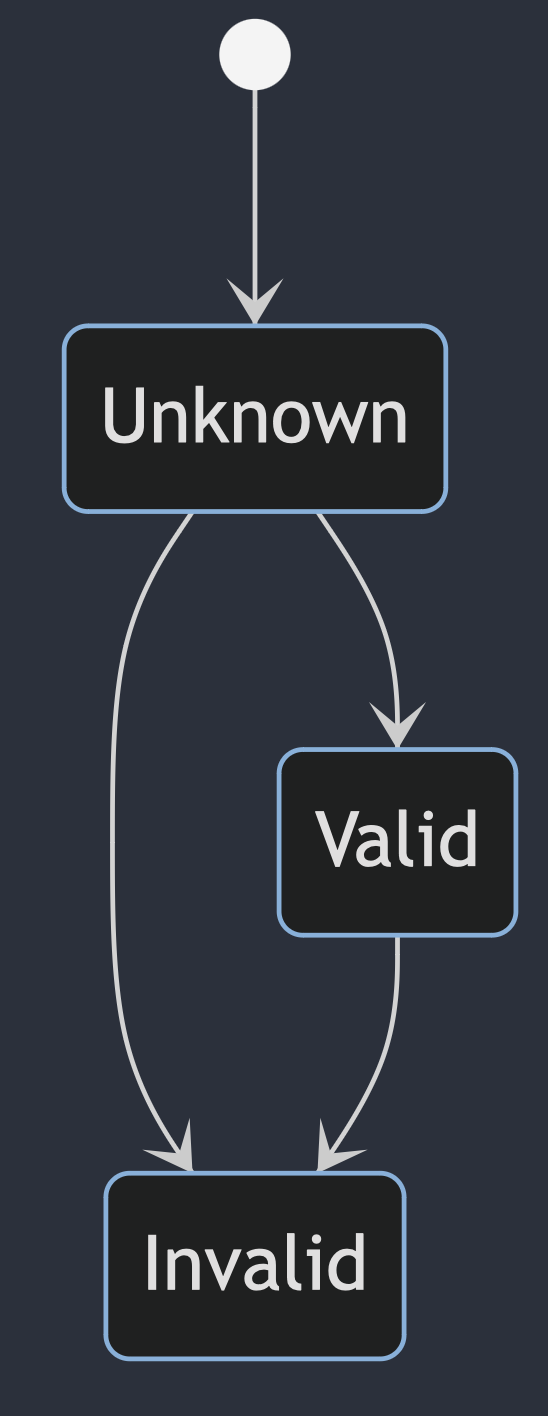
For testing purpose I have selected a normal diagram from our client’s documentation and anonymizes the texts on it. The image contains 3 separate models which I think is quite a hard for the model to interpret.
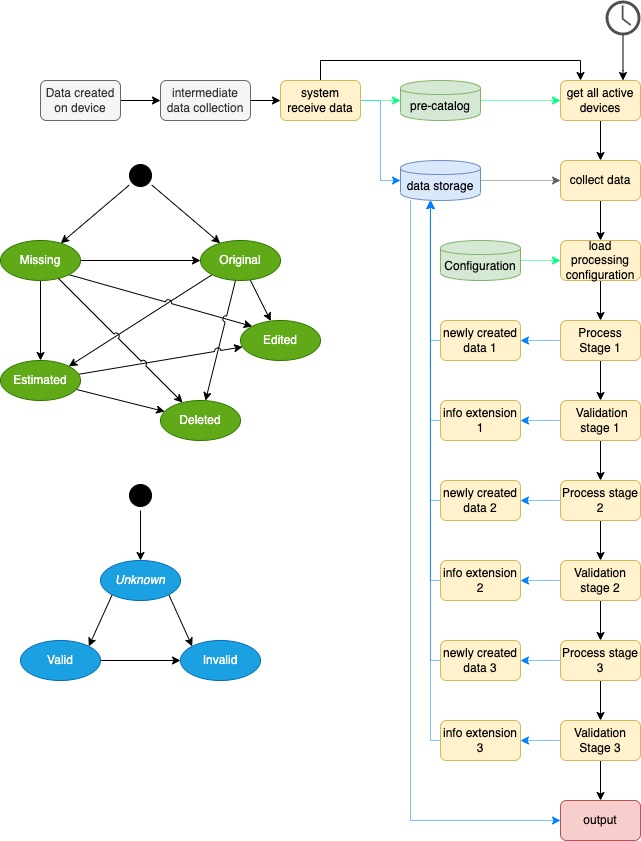
But to make the task easier I cut the image to 3 parts to test if with simpler images (one model in each) the result will change or not.
Test 1: The Zero-Shot Challenge
The first test employed a zero-shot prompting technique, where the AI was asked to identify and describe diagram models without any prior examples or training specific to our task.
The results were a mixed bag:
Pros: The OCR (Optical Character Recognition) performance was commendable, with the AI accurately recognizing text within the diagrams.
Cons: The AI struggled with accurately identifying state changes and maintaining the structural integrity of the diagrams. Several sub-diagrams were either partially recognized or misinterpreted, leading to incomplete or fragmented Mermaid UML outputs.
Basic prompt
Given the image, provide the following information:
– Try to identify one or more graph model or uml model
– for each model identify the model structure and texts
– generate Mermaid diagram descriptions from each of the identified model
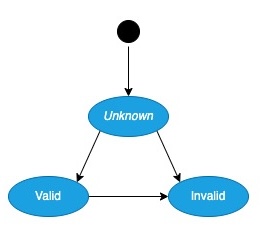
The Markdown formatted version of the Validity diagram (in Mermaid format)
graph TD
    Unknown -->|Valid| Valid
    Unknown -->|Invalid| Invalid
Test 2: Enhancing the Prompt
Building on the insights gained, the prompt was refined to provide more detailed instructions to the AI, emphasizing the identification of starting points, the significance of clock-shaped circles as scheduler tasks, and the handling of overlapping arrows. The revised prompt yielded improvements but still fell short in terms of accurately reconstructing the diagrams.
Test 3: The Greyscale Experiment
A notable pivot in our experimentation was the shift to using greyscale images, based on the hypothesis that reducing color complexity might streamline the AI’s processing capabilities (less information in the images can cause less stress on the model). The results, however, indicated that while OCR accuracy remained high, the overall interpretation of the diagrams’ structure and flow did not significantly improve.
Test 4: Refining the Approach
Further tests involved tweaking the AI’s “temperature” settings and providing even more granular instructions in the prompts. These adjustments aimed to fine-tune the AI’s focus and improve its output accuracy. Despite these efforts, challenges persisted, notably in the AI’s consistent struggle with diagram complexity and its tendency to either oversimplify or inaccurately represent connections and state changes.
Prompt version N-1
You are a professional IT Business Consultant with extraordinary modelling skills.
Given the image, provide the following information:
– First identify one or more separate diagrams in the image (separate means they have don’t have any line or arrow connections)
– the model main elements are the states which represented with some kind of closed shape (ellipse, rectangle, rounded rectangle, etc) with text in them. identify them and their text.
– don’t leave any closed shape with text inside out from the final output
– the blacked filled circle means a starting point in the graphs. Use it as a state element with name START
– clock shape circle without text is a starting point which represents a scheduler task. Use it as a state element with name SCHEDULER
– if you find a closed shape without text in it than use XXX as their representation
– between the elements there can be lines with arrow on one side of them. identify every line which connects two shapes
– lines can overlap with each other. this means if a line reach an another but cannot continue its route than it means it is connected to the other and their target are the same
– multiple line can overlap with each other
– lines can cross each other. assume that if two lines cross each other than it can be signed with a small tunnel like break in one of the lines
– use only exactly identified connections between elements and do not create new ones
– if a line cannot be categorized for sure than leave it out from the output
– do not use the colors on the diagrams
– keep every element in the graph
– dont write text on arrows which doesn’t have content on the image
Generate Mermaid diagram descriptions from each of the identified model (can use flowchart, state diagram or sequence diagram)
Do not write any intermediate text about the result just the required output format.
Prompt version N
You are a professional IT Business Consultant with extraordinary modelling skills.
Given the image, provide the following information:
– First identify one or more separate shape groups in the image. Every shape has to be in the same shape group if they are connected visually together.
– Than for every shape group identify their main elements (states) which represented with some kind of closed shape (ellipse, rectangle, rounded rectangle, etc) with text in them. identify them and their text.
– Don’t leave any closed shape with text inside out from the final output
– The blacked filled circle means a starting point in the graphs. Use it as a state element with name START or if you create a state diagram from it later than jus use as a starting point of the diagram
– clock shape circle without text is a starting point which represents a scheduler task. Use it as a state element with name SCHEDULER
– Than for every element and state identify every outgoing lines from them and identify the connected target element or state. Lines can be straight or can bend one or more times. Lines can be continuous line or with can be represented with dotts.
– Every line have direction and the target side of the line ends with in arrow like ending.
– keep every element in the graph
– dont write text on arrows which doesn’t have content on the image
Think step-by-step but do not write the intermediate results just the final output
Generate Mermaid diagram descriptions from each of the identified model (can use flowchart, state diagram or sequence diagram)
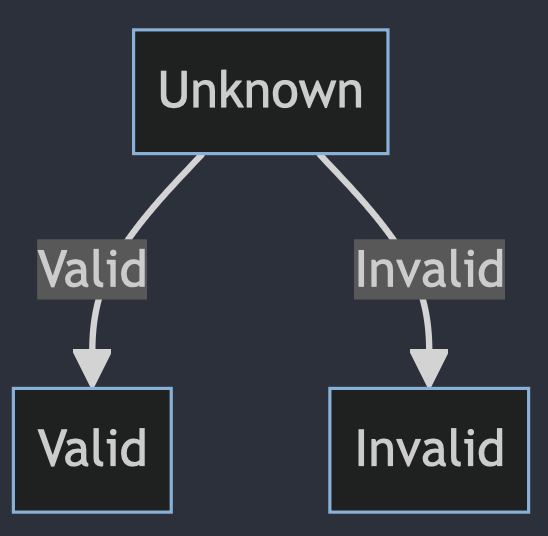
In some cases the simplest validity diagram was interpreted fully
stateDiagram-v2
  [*] --> Unknown
  Unknown --> Valid
  Unknown --> Invalid
  Valid --> Invalid
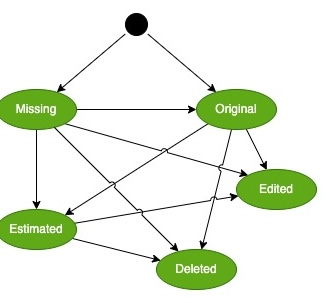
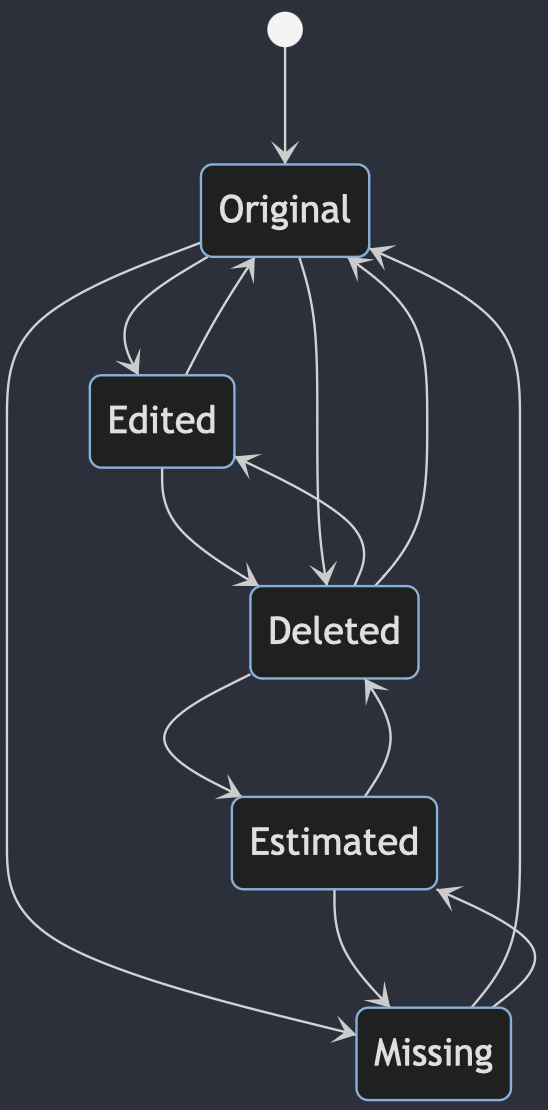
But the other diagrams still have a lot of issues on the output
stateDiagram-v2
    [*] --> Original
    Original --> Edited
    Edited --> Original
    Original --> Missing
    Missing --> Original
    Missing --> Estimated
    Estimated --> Missing
    Estimated --> Deleted
    Deleted --> Estimated
    Deleted --> Edited
    Edited --> Deleted
    Original --> Deleted
    Deleted --> Original
Lessons Learned and the Path Forward
The journey through these tests revealed several key insights:
- OCR Strengths: The AI’s ability to recognize and transcribe text from the diagrams was consistently strong, indicating a solid foundation for further refinement.
- Diagram Complexity: Complex diagrams pose significant challenges, with the AI often misinterpreting or overlooking critical elements and connections.
- Image Quality and Format: Adjustments in image quality and format (e.g., greyscale conversion) did not materially impact the effectiveness of the diagram interpretation.
- Prompt Precision: The specificity and clarity of the prompts play a crucial role in guiding the AI towards more accurate outputs. Incremental improvements were observed with more detailed and structured prompts.
Conclusion
While the quest to perfectly translate technical diagrams into textual formats using OpenAI Vision is ongoing, this exploration has laid crucial groundwork. It’s clear that achieving high accuracy in this task requires a nuanced understanding of both the AI’s capabilities and the inherent complexities of technical diagrams. Future endeavors will likely need to explore alternative strategies, including direct XML processing or further refined AI prompts, to overcome the observed challenges.
In our next installment, we’ll delve deeper into alternative approaches and continue our pursuit of the elusive perfect RAG. Stay tuned, as our journey into the graphical labyrinth of technical documentation continues.